Application Case Analysis of Low Field Nuclear Magnetic Resonance in Conventional Core Analysis |
| Core analysis is a necessary means to understand the geological characteristics of oil and gas layers. As a porous medium, rock's internal pore structure, the movement state of molecules in the pores, the reaction process and other phenomena are important for core analysis. Question. In recent years, low-field NMR core analysis technology has become an important means to quickly measure rock physical parameters. It is suitable for laboratory research and oilfield field applications, and has been widely recognized by the petroleum industry, and its application fields are increasingly widespread. |
| case analysis | 1. Determination of porosity |
| 
|
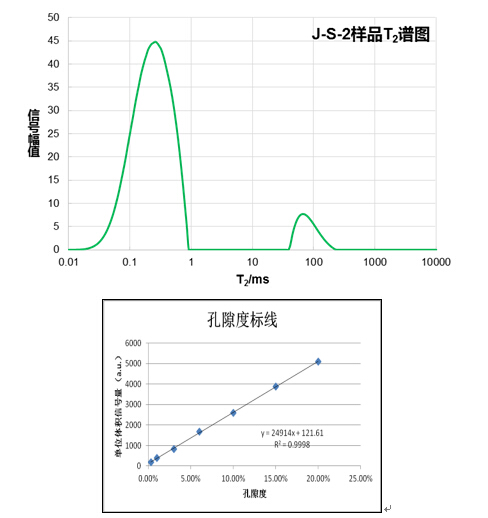
| When the pores of the rock sample are filled with fluid, the amount of fluid is equal to the pore volume. The integral sum of the relaxation time spectra measured by the nuclear magnetic resonance technique represents the fluid content in the formation core, so if the relaxation time spectrum is appropriate With the scale, the nuclear magnetic porosity of the rock can be obtained. |
| 2. Determination of oil saturation |
| 
|
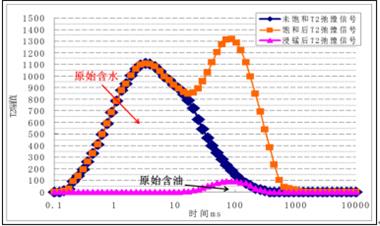
| In the original state, the T2 relaxation spectrum of the core sample is measured, and the corresponding peak area corresponds to the original oily water saturation. The core is immersed in the manganese ion solution to suppress the water signal. At this time, the original oil saturation is obtained by T2 spectrum test, and the original oil saturation is obtained by subtracting the original oil saturation from the original oily water saturation. |
| 3. Determination of wettability |
| 
|
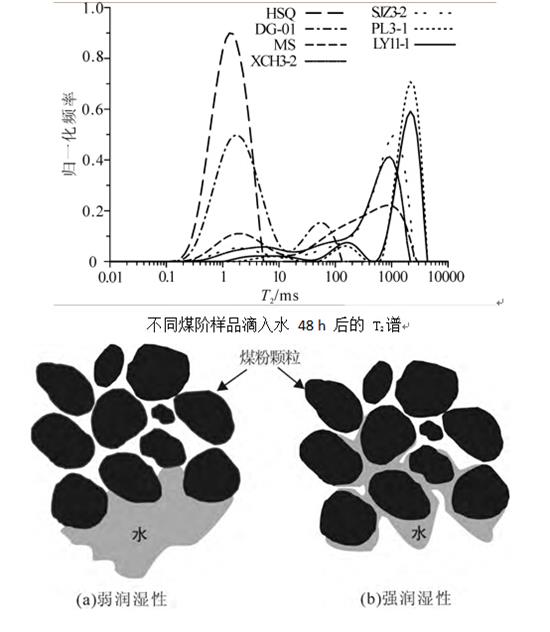
| The T2 relaxation spectrum measured by water droplets entering the strong water wet coal powder only has the water peak between the adsorption state and the water peak. The weak water wet coal powder has free water peak, interparticle water peak and adsorption water peak. The more wet the coal powder is, the more obvious the water is diffused between the pulverized coal particles. The larger the water film area formed between the particles, the shorter the relaxation time between the water peak and the free state water peak, and the shift to the left with time. The more obvious. |
| 4, rock freeze-thaw damage |
| 
|
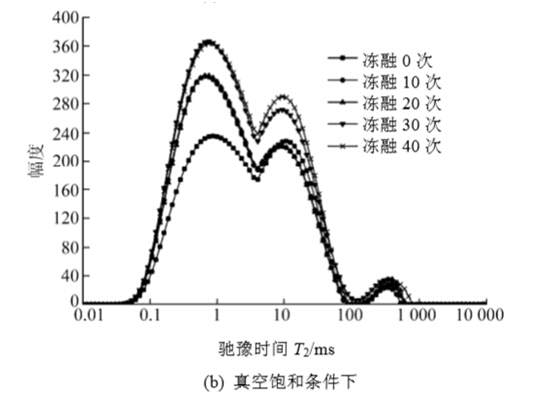
| After 40 freeze-thaw cycles, the T2 spectrum distribution of granite is mainly represented by three peak maps. As the number of freeze-thaw cycles increases, the T2 spectrum shifts to the left, which is shifted toward the T2 spectrum of small pores. This also shows that under the action of frost heaving and melting of ice, new micropores are generated inside the rock. 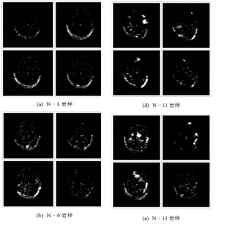
The bright color area in the image is the area where the water molecules are located, and the surrounding black area is the ground color. The brighter the image color, the higher the moisture content in this area, indicating that the larger the gap is, the more the freezing and thawing times increase, the brightness increases, and the porosity becomes larger. . |
| 5. Study on mechanical properties of triaxial compression damage |
| 
|
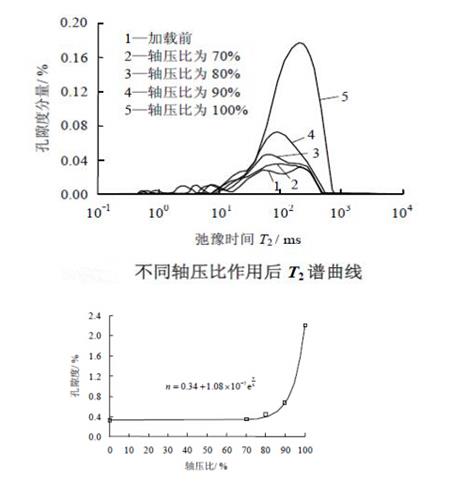
| As the axial pressure increases, the porosity generally increases exponentially. When the axial compression ratio is in the range of 0-70%, the slope of the curve is small, the crack inside the rock develops slowly, and the damage increment is small. When the axial compression ratio is in the range of 70%-90%, the slope of the curve increases obviously, and the porosity The increment is larger and the growth rate is faster and faster, which indicates that the number of cracks in the marble increases, the crack opening increases, the damage degree increases, and the marble gradually transforms from elastic deformation to plastic deformation; when the axial compression ratio is between 90% and 100 In the % segment, the slope of the curve increases sharply, the porosity increases exponentially, and the pores inside the rock accelerate and expand and penetrate, and the damage increases sharply until it breaks. |
| 6. Core high temperature and high pressure displacement experiment |
| 
|
| Red represents the signal of the oil and green represents the signal of the water. 0PV stands for saturated oil, then water drive, from left to right, the middle part is first displaced, and some oil remains on the end face. By imaging observation, the dominant channel and end effect can be seen. 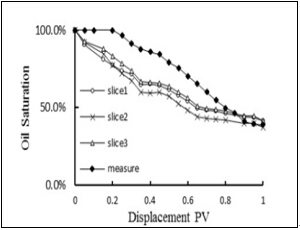
The overall signal of the displacement process is gradually weakened, and the signal attenuation rate of the second core is greater than that of the third and fourth layers, which is consistent with the image. On the one hand, nuclear magnetic resonance test can be used to evaluate the internal displacement process of the sample. On the other hand, combined with magnetic resonance imaging technology, the fluid change inside the core of the displacement process can be directly understood. | | | Contact: Gao Manager | Contact Phone | E-mail: |
|