Understanding Cellular Change Process Based on Single Cell Data - Detailed Analysis of Quasi-Time Series Analysis
The development of single-cell detection technology provides a powerful tool for understanding the composition and functioning and changing processes of cells in complex living organisms. Based on the single-cell gene expression profile data, we can explore the intracellular regulatory changes during development, discover the various types of cells in the tumor microenvironment and their intercellular communication, and understand the complex and diverse cell types in organ tissues. The existing single-cell study is a process of reconstructing the whole from the whole to the individual and then from the individual characteristics. In this process, there are some very interesting questions that we hope to understand through single-cell data, such as the development process of certain types of cells in a certain organization; under different conditions, the process of cell change and fate, etc. . Therefore, we need to achieve the classification and reduction of data through specific analysis methods, and through the data to outline the process of cell-to-cell changes. In this context, quasi-time series analysis (Pseudotime analysis) provides us with a tool to solve this problem.
Quasi-time series analysis (Pseudotime analysis) literally means remodeling the process of cells over time by constructing a trajectory of changes between cells. From the specific classification analysis and complexity, it can be divided into cell trajectory analysis and cell lineage analysis.
Cell trajectory analysis refers to the analysis of the cell trajectory of a simple model. It usually refers to the specific end point of the cell along a certain process. The trajectory has a simple tree structure, one end is the "root" and the other end is the "leaf". Cell lineage analysis usually refers to a certain type of progenitor cells, under certain conditions, there are multiple developmental trajectories and fates, and the process of change is similar to the process of complex dendritic branch changes. Therefore, simple cell trajectory analysis and cell lineage analysis are similar in principle, and the degree of complexity is different. Of course, the analysis methods and methods based on this will be different.
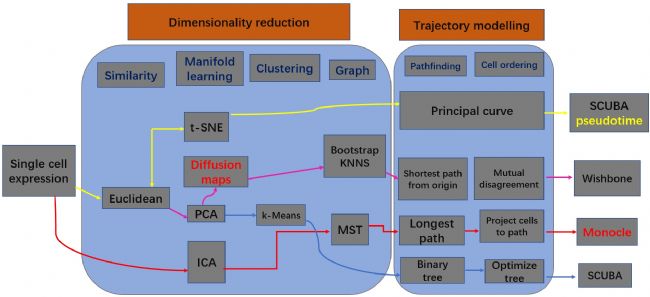
The recent development of single-cell detection technology has also ignited an outbreak based on single-cell data analysis techniques. From the existing published research, there are different types of analysis methods for quasi time series analysis. We organize the following common analysis strategies as follows:
Below we take the quasi-time analysis of Monocle software as an example, and use a simple model to understand what kind of results we can get through this analysis.
Quasi-time series analysis includes three basic steps: gene selection, data dimensionality reduction, and cell alignment in a quasi-time:
Select gene
Inferring a single cell trajectory is a machine learning problem. The first step is to select the gene input by the machine learning method. This is called feature selection, which has a large effect on the shape of the trajectory. The algorithm sorts the cells by examining the expression patterns of these genes in the cell population. Look for genes that are "fun", not just noisy, and use these genes to construct data. These genes will produce a robust, accurate and biologically significant trajectory.
2. Data dimensionality reduction
Once the cells are ordered, we can visualize the trajectory in the dimensionality reduction space, so we first select the genes for cell sorting and then use the inverse map embedding algorithm to reduce the data.
3. Arrange cells in the time of quasi-time
By projecting expression data into a lower dimensional space, machine learning is used to describe how cells transition from one state to another. Suppose the trajectory has a tree structure with one end being the "root" and the other end being the "leaf". Match the best tree to the data as much as possible. This task is called “manifold learning.†At the beginning of the biological process, the cells start at the roots and move along the trunk until the first branch is reached, if any. Then, the cell must choose a path that goes further and further along the tree until it reaches a leaf. The pseudo-time value of a cell is its distance back to the root.
Through this process, we can get a cell trajectory map classified by different cell types:
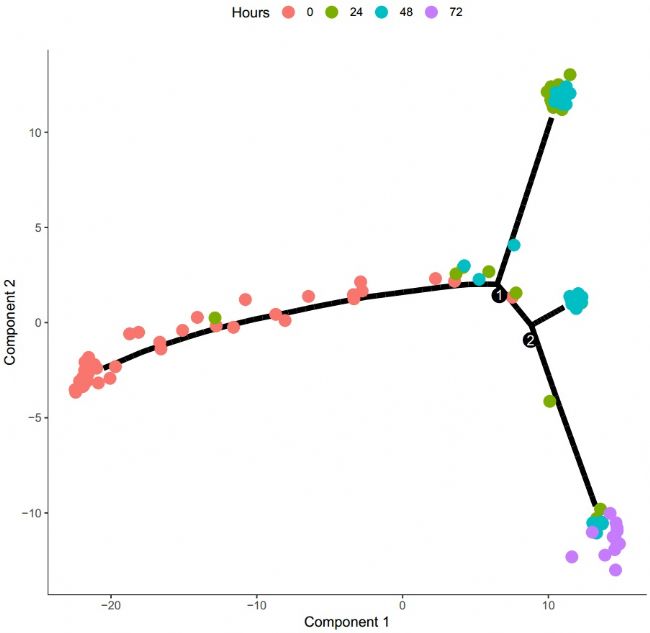
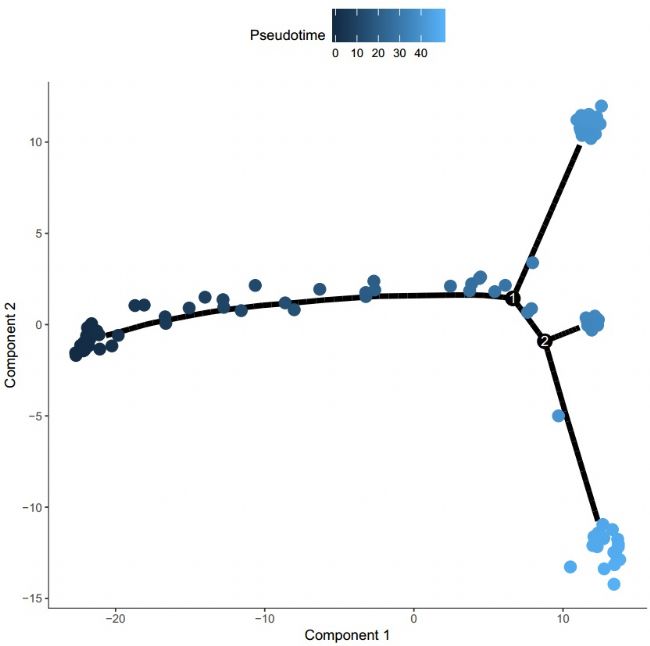 Figure 4 Quasi-time trajectory
After obtaining the above-mentioned quasi-time trajectory map, we can classify and draw according to different stages, and obtain the following results:
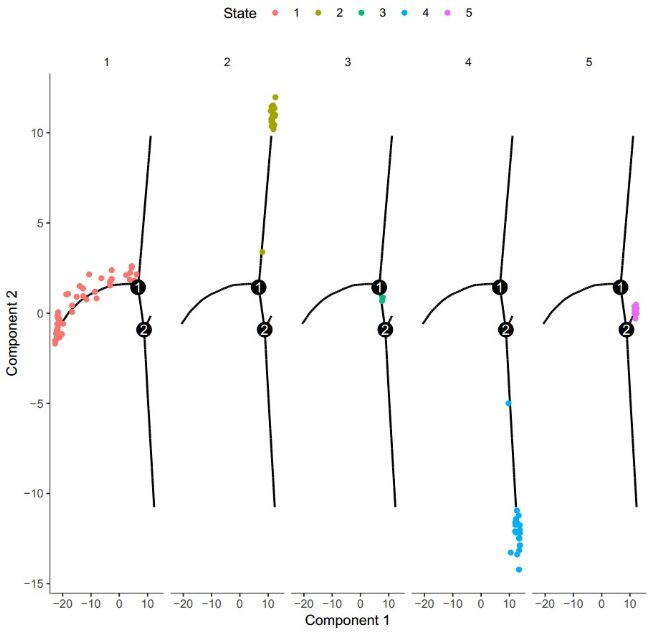 Figure 5 State classification cell trajectory
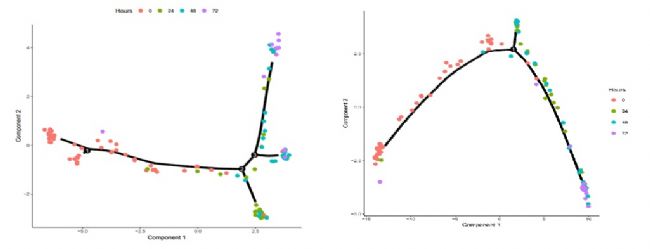 Figure 6 Differential gene trajectory map and unsupervised clustering trajectory map
 Figure 7 scatter plot of each state of differential gene expression
In addition, depending on the cell type classification, we can also plot the differential gene along different time-domain trajectories to map different types of cellular gene expression:
Figure 8 Differential gene quasi-time expression trajectory map
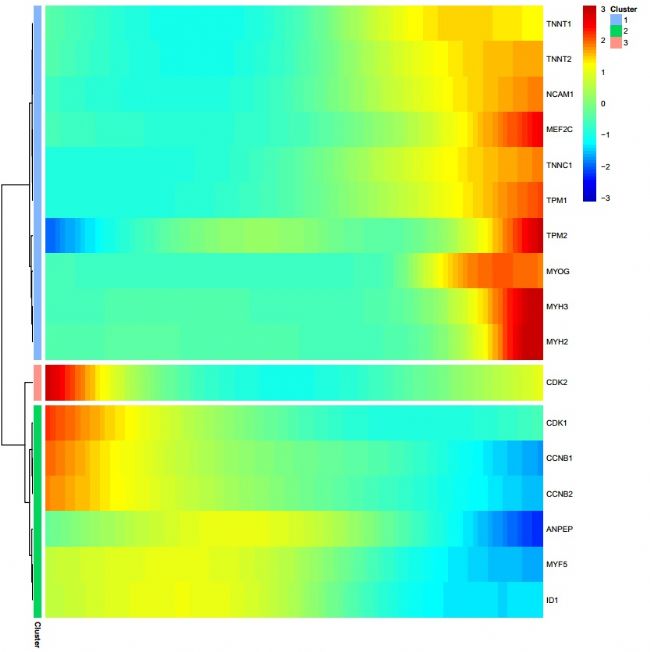 Figure 9 Differential gene clustering heat map
Therefore, through quasi-time series analysis, we can realize the path of constructing cell trajectories and find the trajectory change process of characteristic difference genes, which will provide a basis for us to deeply understand the important regulatory effects of different genes in a certain cell change process.
The above-mentioned quasi-time series analysis results are independently completed by the bioinformatics experts of Shanghai Biochip Co., Ltd. If you have related requirements, please contact Shanghai Biochip Co., Ltd. service platform.
Quasi-time series analysis (Pseudotime analysis) literally means remodeling the process of cells over time by constructing a trajectory of changes between cells. From the specific classification analysis and complexity, it can be divided into cell trajectory analysis and cell lineage analysis.
Cell trajectory analysis refers to the analysis of the cell trajectory of a simple model. It usually refers to the specific end point of the cell along a certain process. The trajectory has a simple tree structure, one end is the "root" and the other end is the "leaf". Cell lineage analysis usually refers to a certain type of progenitor cells, under certain conditions, there are multiple developmental trajectories and fates, and the process of change is similar to the process of complex dendritic branch changes. Therefore, simple cell trajectory analysis and cell lineage analysis are similar in principle, and the degree of complexity is different. Of course, the analysis methods and methods based on this will be different.
The recent development of single-cell detection technology has also ignited an outbreak based on single-cell data analysis techniques. From the existing published research, there are different types of analysis methods for quasi time series analysis. We organize the following common analysis strategies as follows:
Figure 1 Single cell quasi time series analysis of different strategies and processes
Below we take the quasi-time analysis of Monocle software as an example, and use a simple model to understand what kind of results we can get through this analysis.
Quasi-time series analysis includes three basic steps: gene selection, data dimensionality reduction, and cell alignment in a quasi-time:
Select gene
Inferring a single cell trajectory is a machine learning problem. The first step is to select the gene input by the machine learning method. This is called feature selection, which has a large effect on the shape of the trajectory. The algorithm sorts the cells by examining the expression patterns of these genes in the cell population. Look for genes that are "fun", not just noisy, and use these genes to construct data. These genes will produce a robust, accurate and biologically significant trajectory.
2. Data dimensionality reduction
Once the cells are ordered, we can visualize the trajectory in the dimensionality reduction space, so we first select the genes for cell sorting and then use the inverse map embedding algorithm to reduce the data.
3. Arrange cells in the time of quasi-time
By projecting expression data into a lower dimensional space, machine learning is used to describe how cells transition from one state to another. Suppose the trajectory has a tree structure with one end being the "root" and the other end being the "leaf". Match the best tree to the data as much as possible. This task is called “manifold learning.†At the beginning of the biological process, the cells start at the roots and move along the trunk until the first branch is reached, if any. Then, the cell must choose a path that goes further and further along the tree until it reaches a leaf. The pseudo-time value of a cell is its distance back to the root.
Through this process, we can get a cell trajectory map classified by different cell types:
Figure 2 cell trajectory
From the above trajectory map, we can basically divide the trajectory pathways of these cells into five different phases. Therefore, the trajectory map can be drawn with the state to clarify the trajectory process phase:
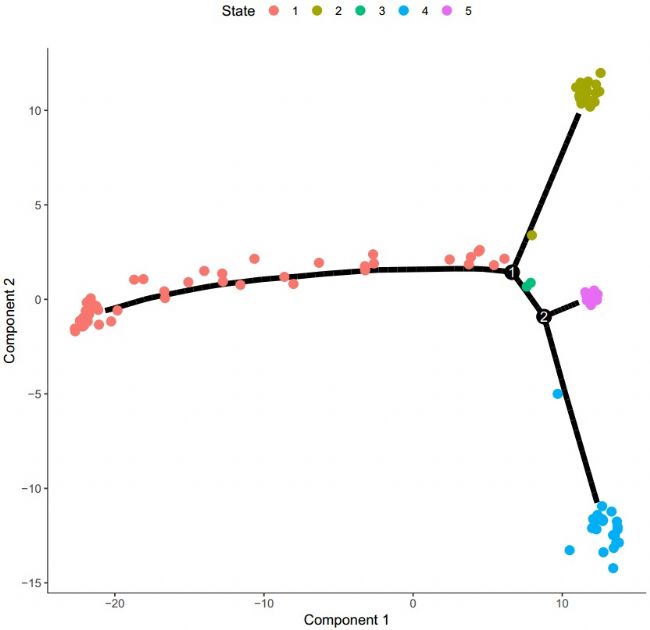
Figure 3 Cell trajectory map (classified by stage)
Of course, through the above analysis, we can't judge the beginning of the trajectory, so we can't determine the trajectory. Therefore, we need to combine the existing knowledge, through the function to identify the state of most cells containing zero time, draw a pseudo-time trajectory map:
Figure 4 Quasi-time trajectory After obtaining the above-mentioned quasi-time trajectory map, we can classify and draw according to different stages, and obtain the following results:
Figure 5 State classification cell trajectory With the basic trajectory map, we can verify the trajectory obtained by sequencing the cell differential genes. It can be seen that the trajectory produced by differential gene sequencing is very similar to the trajectory obtained by unsupervised methods, but it is more "clean".
Figure 6 Differential gene trajectory map and unsupervised clustering trajectory map Next, according to different cell states, different genes are mapped along different State classifications to show the process of gene change.
Figure 7 scatter plot of each state of differential gene expression In addition, depending on the cell type classification, we can also plot the differential gene along different time-domain trajectories to map different types of cellular gene expression:
Figure 8 Differential gene quasi-time expression trajectory map
Finally, based on the quasi-time series trajectory, we clustered the characteristic difference gene expression changes and displayed the gene change process in the form of heat map:
Figure 9 Differential gene clustering heat map Therefore, through quasi-time series analysis, we can realize the path of constructing cell trajectories and find the trajectory change process of characteristic difference genes, which will provide a basis for us to deeply understand the important regulatory effects of different genes in a certain cell change process.
The above-mentioned quasi-time series analysis results are independently completed by the bioinformatics experts of Shanghai Biochip Co., Ltd. If you have related requirements, please contact Shanghai Biochip Co., Ltd. service platform.
Potassium Chloride,Magnesium Chloride Hexahydrate,Calcium Chloride Granules,Calcium Chloride Dihydrate
Wuxi Yangshan Biochemical Co.,Ltd. , https://www.salesacetates.com